Here's a quick review of what we know.
Elasticity is basically the responsiveness of demand to changes in price.
There are three equations for elasticity. They all work.
Relative Change in Demand/Relative Change in Price
/\ Q / Avg Q
/\ P / Avg P
(Avg P / Avg Q) X (1 / Slope)
INCOME ELASTICITY OF DEMAND IS EXACTLY THE SAME, except instead of responding to changes in Price, demand is responding to changes in Income. As such, we use 'Y' instead of 'P' in the formula
Relative Change in Demand/Relative Change in Price
/\ Q / Avg Q
/\ Y / Avg Y
(Avg Y / Avg Q) X (1 / Slope)
There are two main kinds of goods which are affected by changes in income in different ways.
Normal goods are items which respond positively to changes in income. If your income increases, you buy more of them. As your income decreases, you buy less of them. These include items such as cars or food.
Inferior goods are abnormal goods (although not necessarily of lower quality) which repond negatively to income changes. You buy less of them as your income increases, and more of them as your income decreases. This includes things like Wal-Mart shoes and craft dinner, but it is also dependent on personal tastes. Some inferior goods may be consumed less as income increases, because education also increases as income increases, and these products are considered unhealthy.
LUXURY: Movies (3.5) Electricity (2.0) Autos (1.0) --------> Elasticity is greater than 1
NECESSITIES: Furniture (0.5) Clothing (0.5) Food (0.2)-----> Elasticity is less than 1, but still positive
INFERIOR: Whole Milk (-0.5) Pig Products (-0.2)---------> Elasticity is negative
There are two factors which determine the elasticity of income:
1: Characteristics of the good
2: Taste Preferences
The nature of the good itself will define elasticity, but often, preferences will determine the necessity level of a good. Often, as income increases, there is a move away from staple foods to produce and meats, to restaurant meals.
CROSS ELASTICITY OF DEMAND: The sensitivity of demand in one product to price changes of another product
Relative Change in Demand for Product X/Relative Change in Price for Product Y
/\ QX / Avg QX
/\ PY / Avg PY
(Avg PY / Avg QX) X (1 / Slope)
There are two different scenarios here:
COMPLIMENTARY GOODS: Eg, CDs and Walkman Players
THESE HAVE A NEGATIVE CORRELATION
In other words, the cross elasticity of demand for complimentary goods is negative.
SUBSTITUTE GOODS: EG, Pepsi and Coke
THESE HAVE A POSITIVE CORRELATION
In other words, the cross elasticity of demand for substitute goods is positive
Here is a case scenario which could make us think about the cross elasticity of substitute goods. Gateman was, at one point, down in Ottawa to study this case. Here, Fritto-Lay (a subsidiary of Pepsico) was essentially buying out Hostess Chips (through a multimillion dollar merger). The government saw that this was essentially the creation of a monopoly in the potato chip industry, and rushed in to prevent the merger. The company lawyers for Fritto-Lay, however, were able to conclusively prove that the merger would not, in effect, create a monopoly, because in real markets, other goods such as popcorn and cheese puffs serve as de facto substitute goods for potato chips. Potato chips have a higher cross elasticity of demand with these substitute snack foods, so as a result, Fritto-lay would not be able to create a real market monopoly. Frito-Lay naturally won the case and was allowed the merger..... Hooray!
Econ 101 -> Elasticity: How responsive is the quantity demanded to a change in price?
BC is harmonizing PST & GST into a 12% harmonized sales tax. This means that our tax base is larger (we're going to be taxed fully on more items). Yeeech.
Some politicians have been saying that businesses will pass on their savings to consumers. Prof G. thinks this is rubbish! Why? We will discover and be able to explain it by the end of the week (which is very exciting
1: Price elasticity of Demand
2: Price elasticity of Supply
3: Income elasticity of Demand
4: Cross elasticity of demand
5: Note on Point Elasticity
Price (bottom) elasticity of demand (top): PeD (e will look like n, which is a greek letter eta)
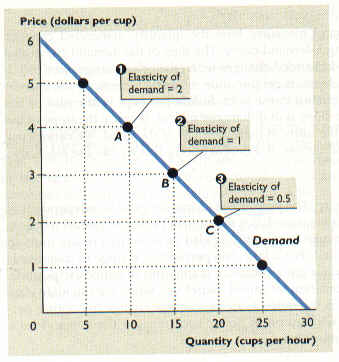
BASICALLY, when we are talking about demand curves, there are two significant factors which we need to take into account when measuring elasticity: LOCATION of the curve, and INCLINATION (slope) of the curve.
Visually, elasticity is a measure of both the location and inclination of a curve. In reality, elasticity is a measure of how responsive the quantity demanded is to a change in price. High elasticity means that demand is highly responsive to price changes. Low elasticity means that demand is not very responsive to price changes.
The formula!
Elasticity = (Average Price/Average Quantity Demanded) X (1/Slope)
Elasticity = Average Change in quantity demanded / relative change in price
It's sort of like an inverted slope, in a sense, but with other factors.
WE WANT TO KNOW THE RELATIVE CHANGE, because the impact of a change depends on its context. 1$ raise is huge if you only make 50 cents per hours. It is negligible if you make 600 dollars per hour. This is why both slop and location are a factor. We use average price and average quantity demanded because if we used only the starting or ending points of an arc to measure elasticity, it would be inaccurate.
Price -bottom- elasticity of Demand -top-
/\Q / Avg Q
/\ P / Avg P

Average Quantity demanded is higher for the curve on the right, so the elasticity will be smaller.

Flatter lines are more elastic, because their inverted slope is greater.
More next time. We are still thrashing this all out.
IMPORTANT: there are lots of formulas out there. whenever possible, just use average prices, average quantity demaned, and slope. It simplifies things!
Some politicians have been saying that businesses will pass on their savings to consumers. Prof G. thinks this is rubbish! Why? We will discover and be able to explain it by the end of the week (which is very exciting
1: Price elasticity of Demand
2: Price elasticity of Supply
3: Income elasticity of Demand
4: Cross elasticity of demand
5: Note on Point Elasticity
Price (bottom) elasticity of demand (top): PeD (e will look like n, which is a greek letter eta)
BASICALLY, when we are talking about demand curves, there are two significant factors which we need to take into account when measuring elasticity: LOCATION of the curve, and INCLINATION (slope) of the curve.
Visually, elasticity is a measure of both the location and inclination of a curve. In reality, elasticity is a measure of how responsive the quantity demanded is to a change in price. High elasticity means that demand is highly responsive to price changes. Low elasticity means that demand is not very responsive to price changes.
The formula!
Elasticity = (Average Price/Average Quantity Demanded) X (1/Slope)
Elasticity = Average Change in quantity demanded / relative change in price
It's sort of like an inverted slope, in a sense, but with other factors.
WE WANT TO KNOW THE RELATIVE CHANGE, because the impact of a change depends on its context. 1$ raise is huge if you only make 50 cents per hours. It is negligible if you make 600 dollars per hour. This is why both slop and location are a factor. We use average price and average quantity demanded because if we used only the starting or ending points of an arc to measure elasticity, it would be inaccurate.
Price -bottom- elasticity of Demand -top-
/\Q / Avg Q
/\ P / Avg P
Average Quantity demanded is higher for the curve on the right, so the elasticity will be smaller.
Flatter lines are more elastic, because their inverted slope is greater.
More next time. We are still thrashing this all out.
IMPORTANT: there are lots of formulas out there. whenever possible, just use average prices, average quantity demaned, and slope. It simplifies things!
Econ 101 4th Real Lecture
Anouncements: The discussion board is up, and test number three is up today!
Review:
Demand is the relationship between the price, and the quantity of any product that a consumer is willing to purchase, given the price, ceteris paribus
Supply is the relationship between the price, and the quantity of any product that a producer is willing to sell, given the price, ceteris paribus
Consumers want to buy more when the price is low because their opportunity cost is lower
Producers want to sell more when the price is high, because their profit margins will be higher
The producer and the consumer don't know each other, so how do we get them to make a deal?
EQUILIBRIUM! YAAAAAAAAAAAY!
Prices ($) Quantity Supplied Quantity Demanded
1.00 7 1
0.80 6 3
0.60 5 5
0.40 3 8
0.20 1 11

An excess in supply (When quantitiy supplied is greater than quantity demanded) creates a pressure for producers to lower their prices
An excess in demand (When quantity demanded is greater than quantity supplied) creates a pressure for producers to raise their prices
BECAUSE OF THIS SUPPLY AND DEMAND TEND TO AUTOMATICALLY GRAVITATE TOWARD A POINT OF EQUILIBRIUM: Where the quanitiy of supply equals the quantity of demand (that is the condition for equilibrium). If you are staying put (remaining constant over time) you are in EQUILIBRIUM! If you are happy, you will stay there.
Stable equilibrium: When changes occur, things resettle toward equilibrium again (things go back to the way they were: eg: blood glucose, a punching bag)
Unstable equilibrium: When change occurs, things do not go back to equilibrium again (eg: the pencil gets knocked over)
LAWS OF SUPPLY AND DEMAND (these deal with SHIFTS in the curve caused by changes in the Ceteris Paribus Variables)
An Increase in Demand increases the equilibrium price, and increases the quantity exchanged (Ipods become more popular, become more expensive, and sell by the truckloads)
A Decrease in Demand lowers the equilibrium price and decreases the quantity exchanged (Tamagotchi becomes unpopular, are bought less often, and can be purchased for fifty cents)
An Increase in Supply decreases the equilibrium price and increases the quantity exchanged (Unconventional Oil lowers the cost of extracting natural gas from rocks, and floods the market with cheap natural gas which costs very little, and is purchased rapidly by consumers)
A Decrease in Supply increases the equilibrium price and decreases the quantity exchanged (Bananas suddenly become extremely expensive to cultivate due to storms ravaging the Caribbean. Producers become less willing to produce bananas, so there are less of them on the market, which sell for a much higher price, because the demand for bananas has not changed)
WOOO
Review:
Demand is the relationship between the price, and the quantity of any product that a consumer is willing to purchase, given the price, ceteris paribus
Supply is the relationship between the price, and the quantity of any product that a producer is willing to sell, given the price, ceteris paribus
Consumers want to buy more when the price is low because their opportunity cost is lower
Producers want to sell more when the price is high, because their profit margins will be higher
The producer and the consumer don't know each other, so how do we get them to make a deal?
EQUILIBRIUM! YAAAAAAAAAAAY!
Prices ($) Quantity Supplied Quantity Demanded
1.00 7 1
0.80 6 3
0.60 5 5
0.40 3 8
0.20 1 11
An excess in supply (When quantitiy supplied is greater than quantity demanded) creates a pressure for producers to lower their prices
An excess in demand (When quantity demanded is greater than quantity supplied) creates a pressure for producers to raise their prices
BECAUSE OF THIS SUPPLY AND DEMAND TEND TO AUTOMATICALLY GRAVITATE TOWARD A POINT OF EQUILIBRIUM: Where the quanitiy of supply equals the quantity of demand (that is the condition for equilibrium). If you are staying put (remaining constant over time) you are in EQUILIBRIUM! If you are happy, you will stay there.
Stable equilibrium: When changes occur, things resettle toward equilibrium again (things go back to the way they were: eg: blood glucose, a punching bag)
Unstable equilibrium: When change occurs, things do not go back to equilibrium again (eg: the pencil gets knocked over)
LAWS OF SUPPLY AND DEMAND (these deal with SHIFTS in the curve caused by changes in the Ceteris Paribus Variables)
An Increase in Demand increases the equilibrium price, and increases the quantity exchanged (Ipods become more popular, become more expensive, and sell by the truckloads)
A Decrease in Demand lowers the equilibrium price and decreases the quantity exchanged (Tamagotchi becomes unpopular, are bought less often, and can be purchased for fifty cents)
An Increase in Supply decreases the equilibrium price and increases the quantity exchanged (Unconventional Oil lowers the cost of extracting natural gas from rocks, and floods the market with cheap natural gas which costs very little, and is purchased rapidly by consumers)
A Decrease in Supply increases the equilibrium price and decreases the quantity exchanged (Bananas suddenly become extremely expensive to cultivate due to storms ravaging the Caribbean. Producers become less willing to produce bananas, so there are less of them on the market, which sell for a much higher price, because the demand for bananas has not changed)
WOOO
Econ 101 Second Lecture
Supply and Demand: This is one of the most important components to Economics.
Demand:
-Quantity Demanded
-Demand Schedules
-Shifts versus Moving Along The Curve
Quantity Demanded is not the same thing as 'Demand'
Supply:
-Quantity Supplied
-Supply Schedules
-Shifts and Movements
Friday: How do you make a deal? How do suppliers and 'demanders' meet in the middle?
DEMAND:
The Quantity Demanded is the quantity a buyer is willing to purchase given the price, (P), with all other things held constant (ceteris paribus).
We are basically measuring two variables against each other: Price and Quantity Demanded. In order to do this, we need to artificially control all of the other possible factors so that they do not affect the graph, etc.
If the price is $1, how many condoms do you want to buy?
If the price is 80 cents, how many condoms do you want to buy?
Here is a demand schedule for Condoms:
Price Quantity Bought
1.00 --> 1
0.80 --> 3
0.60 --> 5
0.40 --> 8
0.20 --> 11
Why do we buy more when the price is lower? BECAUSE THE OPPORTUNITY COST HAS FALLEN! Eg- buying one condom is now the equivalent to 1/16th of a can of coke instead of a whole can of coke.
Price affects our willingness to buy.
There is an inverse relationship between price and the quantity demanded. As price falls, the quantity demanded rises (I work at co-op. I have witnessed this).
HERE ARE THE OTHER FACTORS WHICH CAN AFFECT Quantity Demanded!
-Income
-Tastes
-Advertising
-Price of complimentary goods
-Price of substitute goods
-Population
-Wealth
-Expectations
See Gateman's notes to fill in the details tonight!
Okay. The price of beer drops. What happens to your willingness to buy condoms? It's subjective; different people behave differently. However, for the sake of understanding, you buy more condoms and this is why.
If the price of beer drops, beers opportunity cost is lower, so you will buy more beer. If you buy more beer, you will need to buy more condoms because they are COMPLIMENTARY.
Substitute goods work the opposite way. If two goods are in competition with each other for an example, a drop in Price in one causes you to buy less of the other.
For an example, if the price of coke drops, you will buy less Pepsi.
Wealth is accumulated income, which is storehoused (it's a bit different from income). Generally, the more wealth you have accumulated, the more you spend for both practical and cultural reasons.
Expectations are difficult to prognosticate. The effect of expectations is different for different people. EG: housing market predictions creat expectations.
DEMAND CURVE:
relation between Price, and the Quantity the consumer is willing to purchase, all things held constant (ceteris paribus).
Qd = f (P/I,T,A,Pr, Pop, W, Exp)
Usually, constant variables (the ceteris paribus) are overlined, but he doesn't know how to do this in word processor.
Demand function:
Y = f(x)
Qd = f(P) : This is the math
Inverse Demand Function:
P = g(Qd) : This is the graph
The price is graphed on the Y axis
The Qd is graphed on the X axis
WE DON"T DO QUADRATICS> YAYA!
Subscribe to:
Comments (Atom)